

Refactored AI (refactored.ai)
Refactored AI is an AI-powered, interactive learning platform designed to provide underserved individuals with essential Data Analytics & Data Science skills. This project revitalized an outdated legacy system and integrated a video feedback system to enhance user engagement and learning outcomes.
Janurary 2018 - Present
Colaberry Inc.
My Role
I led the design from ideation to launch, working closely with stakeholders and developers. My responsibilities included user research, wireframing, prototyping, UI design, and quality assurance.
Problem
The existing legacy platform was outdated, difficult to navigate, and lacked engaging features. Users struggled with static content and found it challenging to track their progress and receive timely feedback.
Solution
Develop a modern, user-friendly platform with interactive and personalized learning experiences, including a video feedback system for real-time support and engagement.
Strategy
The strategy focused on user-centered design principles to ensure the platform met the needs and preferences of our students. The process included extensive user research, iterative design, and continuous validation to align the final product with user expectations and industry best practices.
Challenges & Roadblocks
Integration with Legacy System: Ensuring compatibility with the old system required significant backend adjustments.
Overcoming: Collaborated closely with the development team to ensure smooth integration and conducted extensive testing to identify and fix issues.
User Resistance: Some users were initially resistant to change, preferring the familiar legacy system.
Overcoming: Conducted training sessions and provided support to help users transition smoothly. Collected user feedback to continuously improve the platform.
Technical Issues: Initial integration of the video feedback system faced technical glitches.
Overcoming: Resolved through iterative testing and user feedback. Worked with developers to address technical challenges.
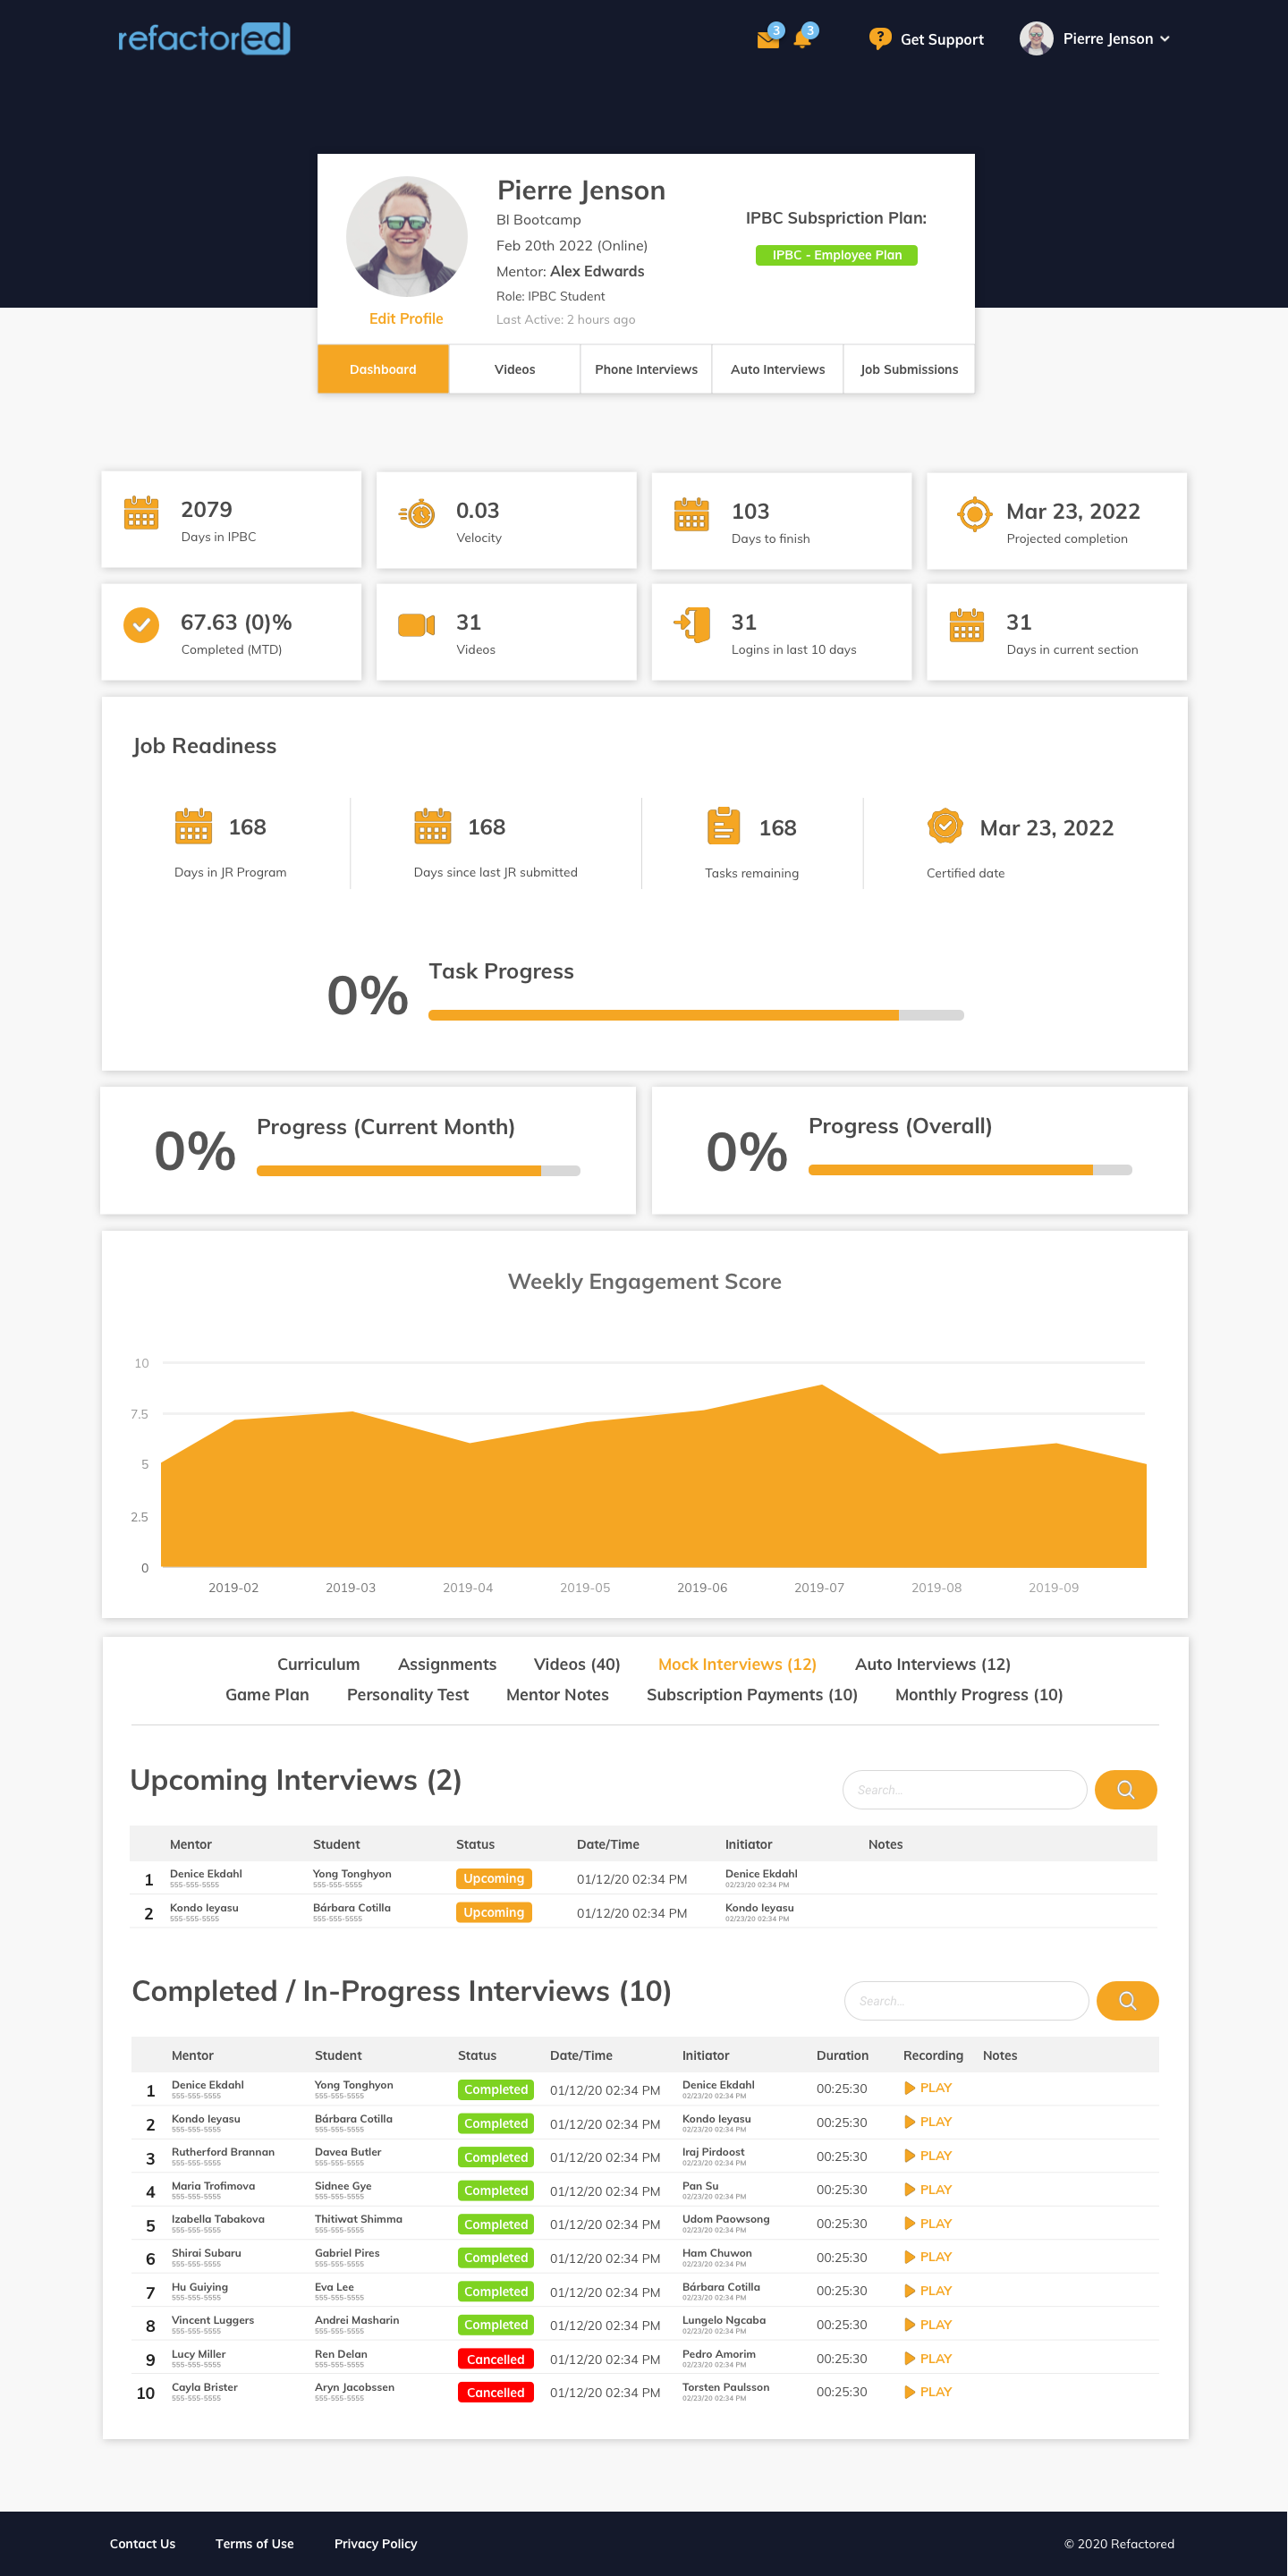
Outcome
Engagement: 5000+ students enrolled and found employment.
Completion Rate: 92% completed at least one course.
Emploment Rate: 98% of students who completed the course found employment in less than 6 months
User Satisfaction: Achieved an average rating of 4.8/5 from student reviews.
Impact: Enabled numerous students to transition into data analytics careers, contributing to workforce diversity.
Metrics & KPIs
User Growth: 10% month-over-month increase in user registrations and enrollments.
Learning Outcomes: 95% of students reported improved skills and confidence in data analytics.
Retention Rate: 70% of students returned to take additional courses.
Feedback: Continuous improvement based on reviews and feedback.
Conclusion
The Refactored AI Learning Platform successfully transformed an outdated legacy system into a modern, interactive learning experience. The project's success is reflected in significant user engagement and positive outcomes, demonstrating the platform's effectiveness in bridging the education gap for underserved communities.
Awards & Recognition


XPRIZE Rapid Reskilling is a $5 million dollar, 30-month competition to quickly reskill under-resourced workers for the digital revolution.
Research & Discovery
Methods:
Interviews: Conducted 20 one-on-one interviews with current and potential users to understand their needs and pain points.
Surveys: Distributed surveys to 100 users to gather quantitative data on user preferences and challenges.
Usability Testing: Performed usability tests with 15 users to identify usability issues in the legacy platform.
Competitor Analysis: Analyzed competitor platforms to identify industry best practices.
Personas: Defined user personas to understand and document user behaviors and needs.
Key Findings
Navigation: "The old platform is confusing and hard to navigate."
Engagement: Users preferred interactive content and real-time feedback over static text.
Personalization: Users desired personalized learning paths to cater to different skill levels.
Survey Results
Navigation Issues: 75% of users reported difficulty navigating the legacy platform.
Preference for Interactive Content: 85% of users preferred interactive content over static text.
Need for Real-Time Feedback: 70% of users expressed the need for real-time feedback to stay engaged.
Overall Findings
Identified the need for a more intuitive interface with clear learning paths.
Recognized the importance of personalization.
Highlighted the demand for an automated feedback system.
Creation of User Personas For Data-Driven Insights
Personas: Defined user personas understand and document user behaviors and needs.
User personas were crucial in understanding our target audience and their needs. By analyzing data from observation sessions, onboarding experiences, and personal immersion, I identified common patterns among users. This informed the development of user personas representing distinct segments within our audience.
Analyzing the data and creating user personas provided insights into user needs, preferences, and pain points. This informed decisions about the design and features of the new platform, leading to a more user-centric and intuitive design. This approach improved user experience, satisfaction, and engagement with the platform.
Key Findings
Global Diversity: 92% of our student body comprises individuals who originated from countries other than the United States but have since become citizens or are currently residing on visas.
Texas Residence: 87% of our students are based in Texas, largely attributed to the robust network of word-of-mouth referrals from our past students and successful graduates.
Career Transitioners: 93% of our students come from diverse professional backgrounds, seeking to embark on a career transition.
IT Novices: 92% of our students have no prior background or experience in the field of Information Technology (IT).


Competitive Analysis For Informed Decision-Making
Competitor Analysis: Analyzed competitor platforms to identify industry best practices.
I conducted a competitive analysis to understand the market landscape and competitors' offerings. By evaluating key players like DataCamp, Dataquest, The Data Incubator, and Editera, I identified their strengths, weaknesses, and unique value propositions. This analysis informed our decision-making process, helping us identify opportunities for differentiation and design features that set us apart. By benchmarking against competitors, we positioned our platform to excel in key areas and leverage our unique value proposition, ensuring a compelling offering for our target audience.
Key Findings
Competitor Features Matrix: DataCamp and Dataquest were found to have the most comprehensive course offerings, while The Data Incubator excelled in providing personalized learning experiences.
User Reviews Analysis: Positive user reviews for Editera praised its affordability but highlighted a lack of advanced features compared to other platforms.
Market Share Analysis: DataCamp was found to have the largest market share, followed by Dataquest, indicating a highly competitive market.
Ideation & Initial Designs
Collaborative Design Iterations & Feedback
Whiteboarding Sessions: Conducted whiteboarding sessions with stakeholders to brainstorm the initial design of the platform and its integration within our ecosystem.
During this phase, I collaborated closely with stakeholders and the development team to gather feedback and insights. Through collaborative discussions and design reviews, we evaluated different design concepts for feasibility and effectiveness. The feedback helped shape the design direction, ensuring alignment with the project's vision.
We began with organized whiteboarding sessions to generate design concepts and ideas. These sessions served as a visual representation of our ideas, allowing us to explore layouts, information architecture, and user flows. Rapidly sketching multiple iterations enabled us to refine our ideas efficiently.
Embracing the iterative nature of sketching, I refined the design concepts quickly before moving to more detailed design stages. This approach allowed me to explore design possibilities, identify usability issues early on, and gather feedback from stakeholders and potential users.
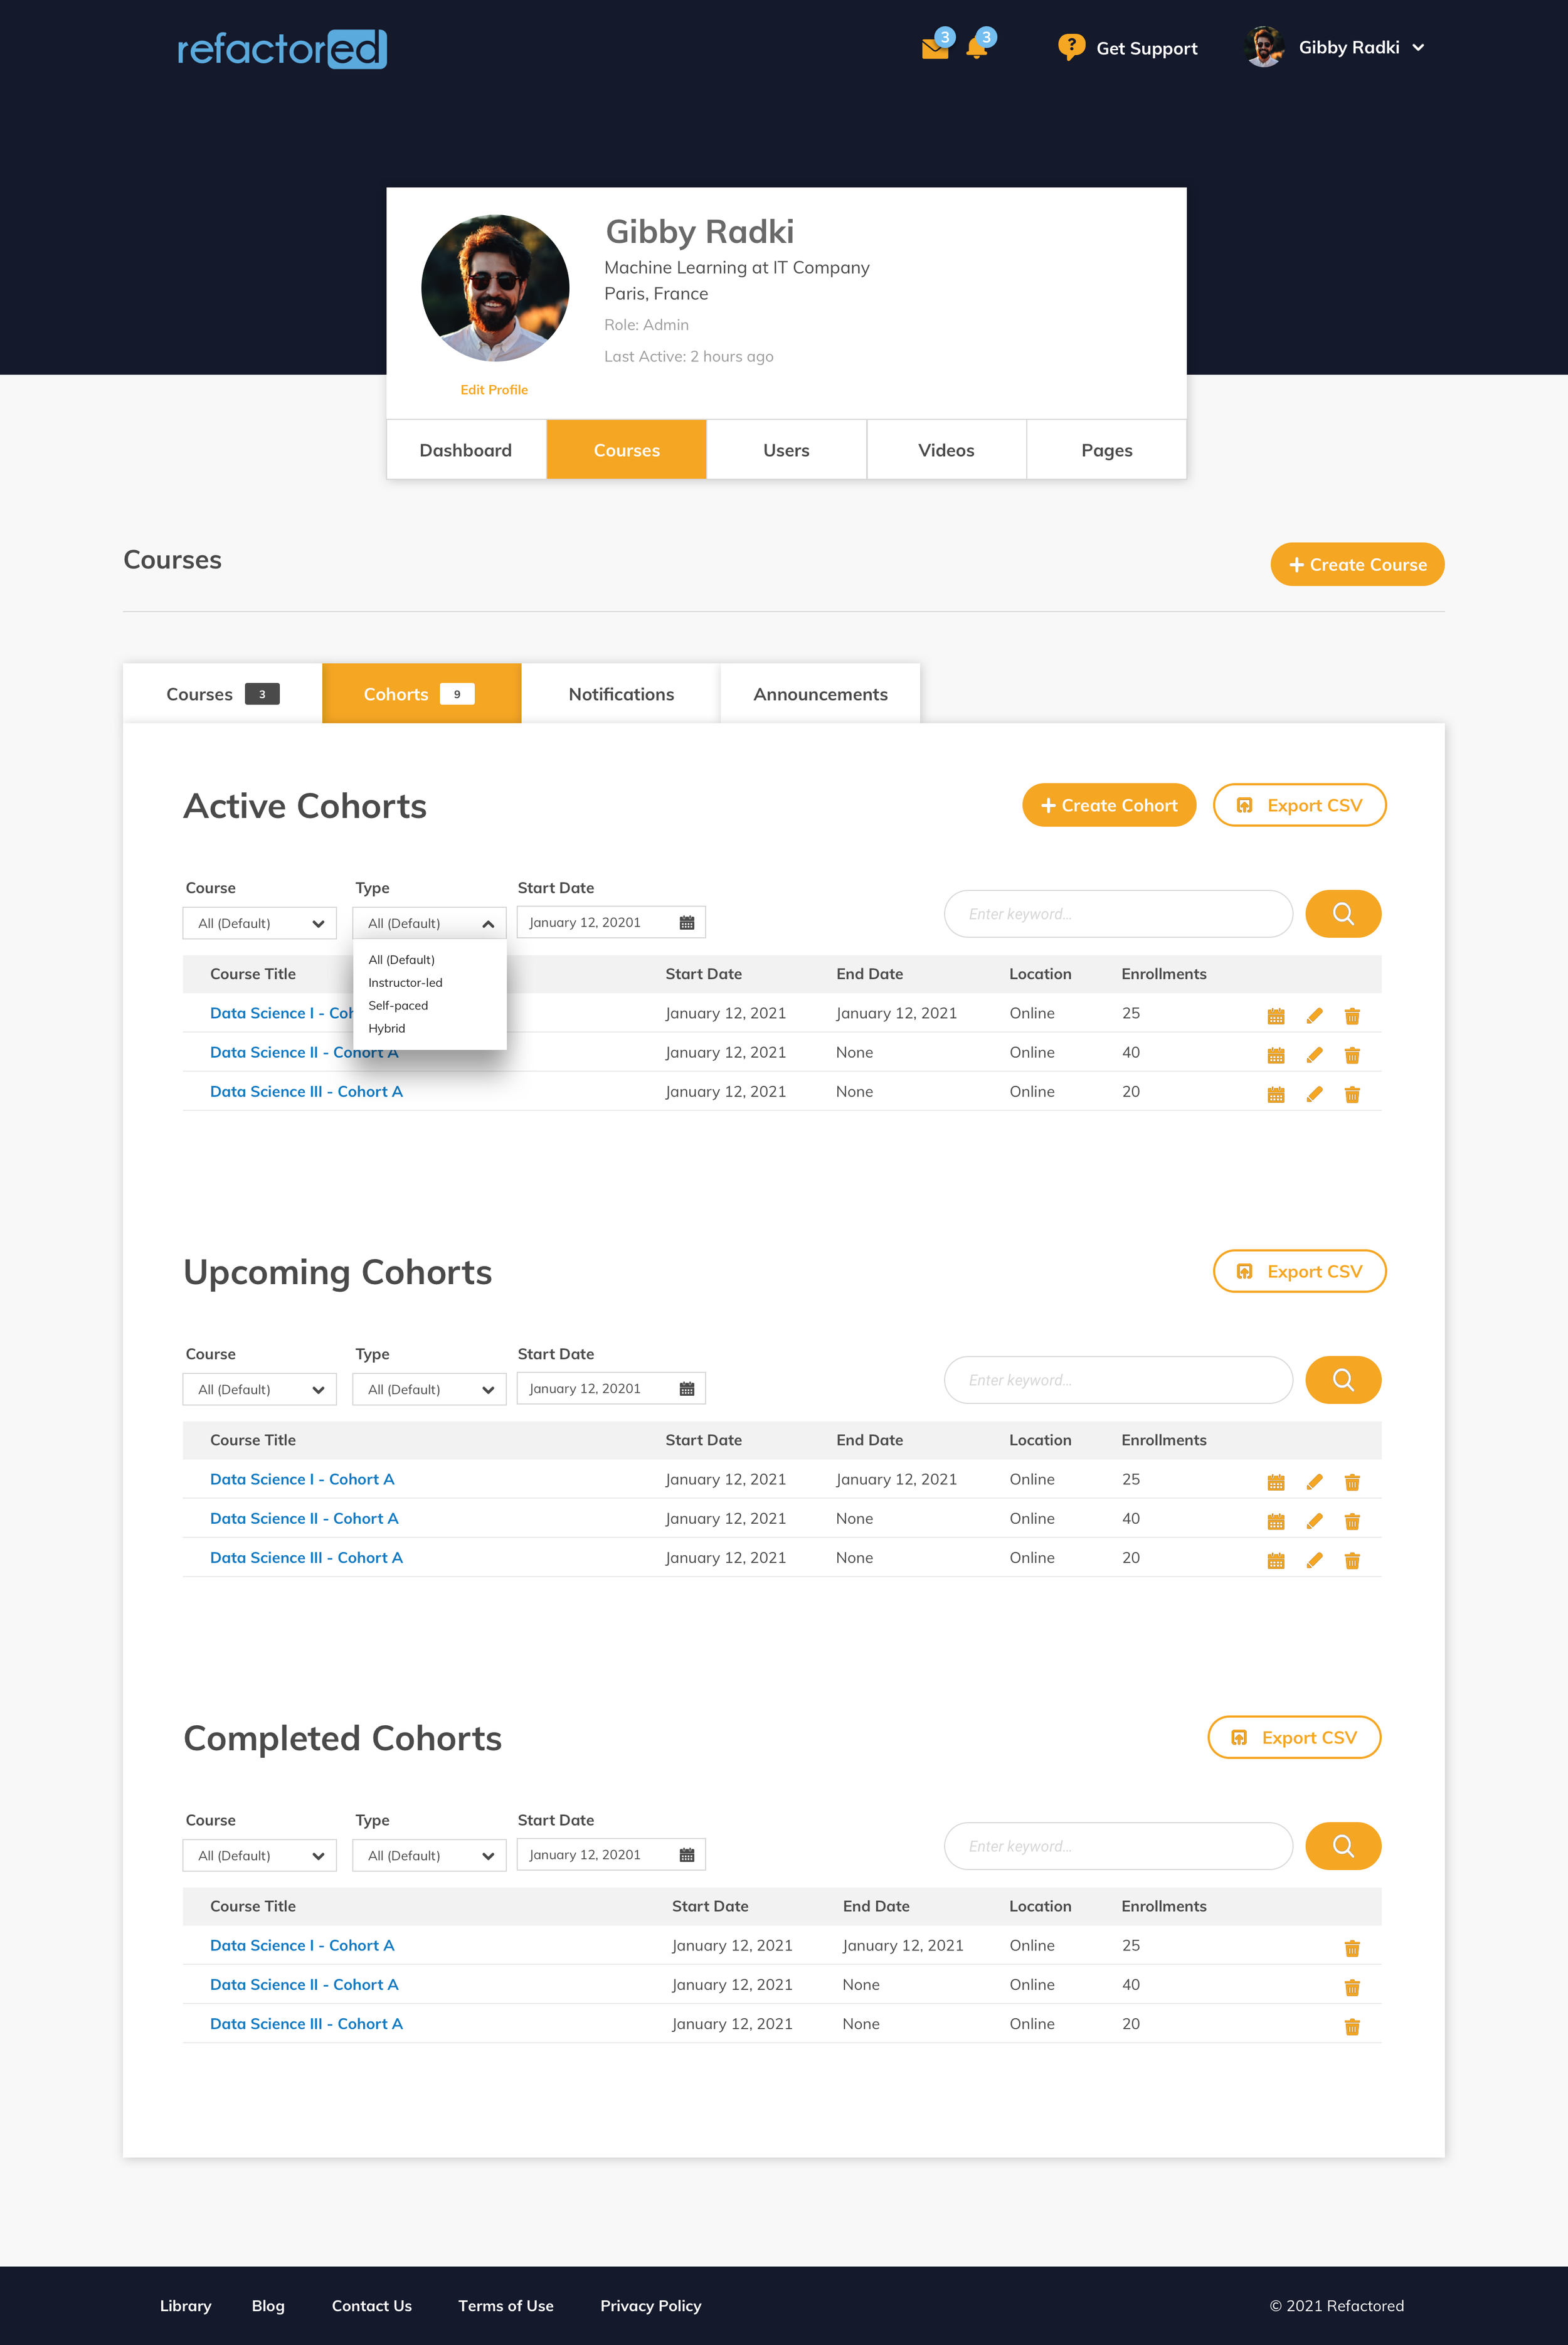
Content Strategy & Curriculum Design
Curriculum Architecture & Design: Collaborated with the Data Science team on curriculum design and strategy to ensure the content met educational goals and user needs.
In developing the learning features, I closely collaborated with our Data Science team to ensure an effective content strategy and curriculum design. While the Data Science team led the creation of the comprehensive curriculum and content, my role focused on organizing the curriculum for optimal presentation on the platform.
Together, we deconstructed the content and organized it into formats such as instructor-led sessions and self-paced learning modules. Our goal was to provide a cohesive learning experience in Data Analytics and Data Science, aligning the curriculum with the platform's capabilities and user needs. This collaboration merged instructional design, curriculum development, and platform functionality expertise, ensuring the content was engaging and adaptable to different learning styles. Overall, our joint efforts enabled the platform to deliver a cohesive and effective learning experience.
Sketching Initial Design Concepts
Sketching: Created initial sketches based on the whiteboarding sessions to visualize the early concepts of the design.
Embracing the iterative nature of sketching, I refined the design concepts quickly before moving to more detailed design stages. This approach allowed me to explore design possibilities, identify usability issues early on, and gather feedback from stakeholders and potential users.


Wireframing, Prototyping & Testing
Wireframes
Wireframing: Developed low-fidelity wireframes to outline the basic structure and layout.


Prototyping & Testing
Prototyping: Created high-fidelity prototypes using Figma to visualize the design.
Testing: Conducted user testing sessions with the high-fidelity prototypes.
Findings:
Navigation: 90% of users found the new navigation intuitive and easier to use.
Engagement: Interactive elements increased user engagement by 40%.
Real-Time Feedback: Users reported a 50% improvement in learning efficiency with the video feedback system.
Completion Rates: Increased by 30% due to the improved interface and feedback mechanisms.
User Feedback: "The new platform is much easier to use and the real-time feedback has been incredibly helpful."
UI Design
High Fidelity Designs
Designed a clean, intuitive interface focused on usability and engagement.
Implemented a responsive design to ensure accessibility across various devices.

Reimagining Our Mock Interview and Communication Skills Development System
Human Skills Development - Empowering Learners Through Colaberry’s Video Feedback Service
Colaberry is committed to democratizing tech education and providing opportunities to marginalized populations worldwide. Our diverse student community includes individuals from 45 countries, including veterans, minorities, women, refugees, immigrants, young adults, career transitioners, and PhDs. Despite this diversity, our community faces the common challenge of navigating the job market in a non-native language with limited communication abilities.
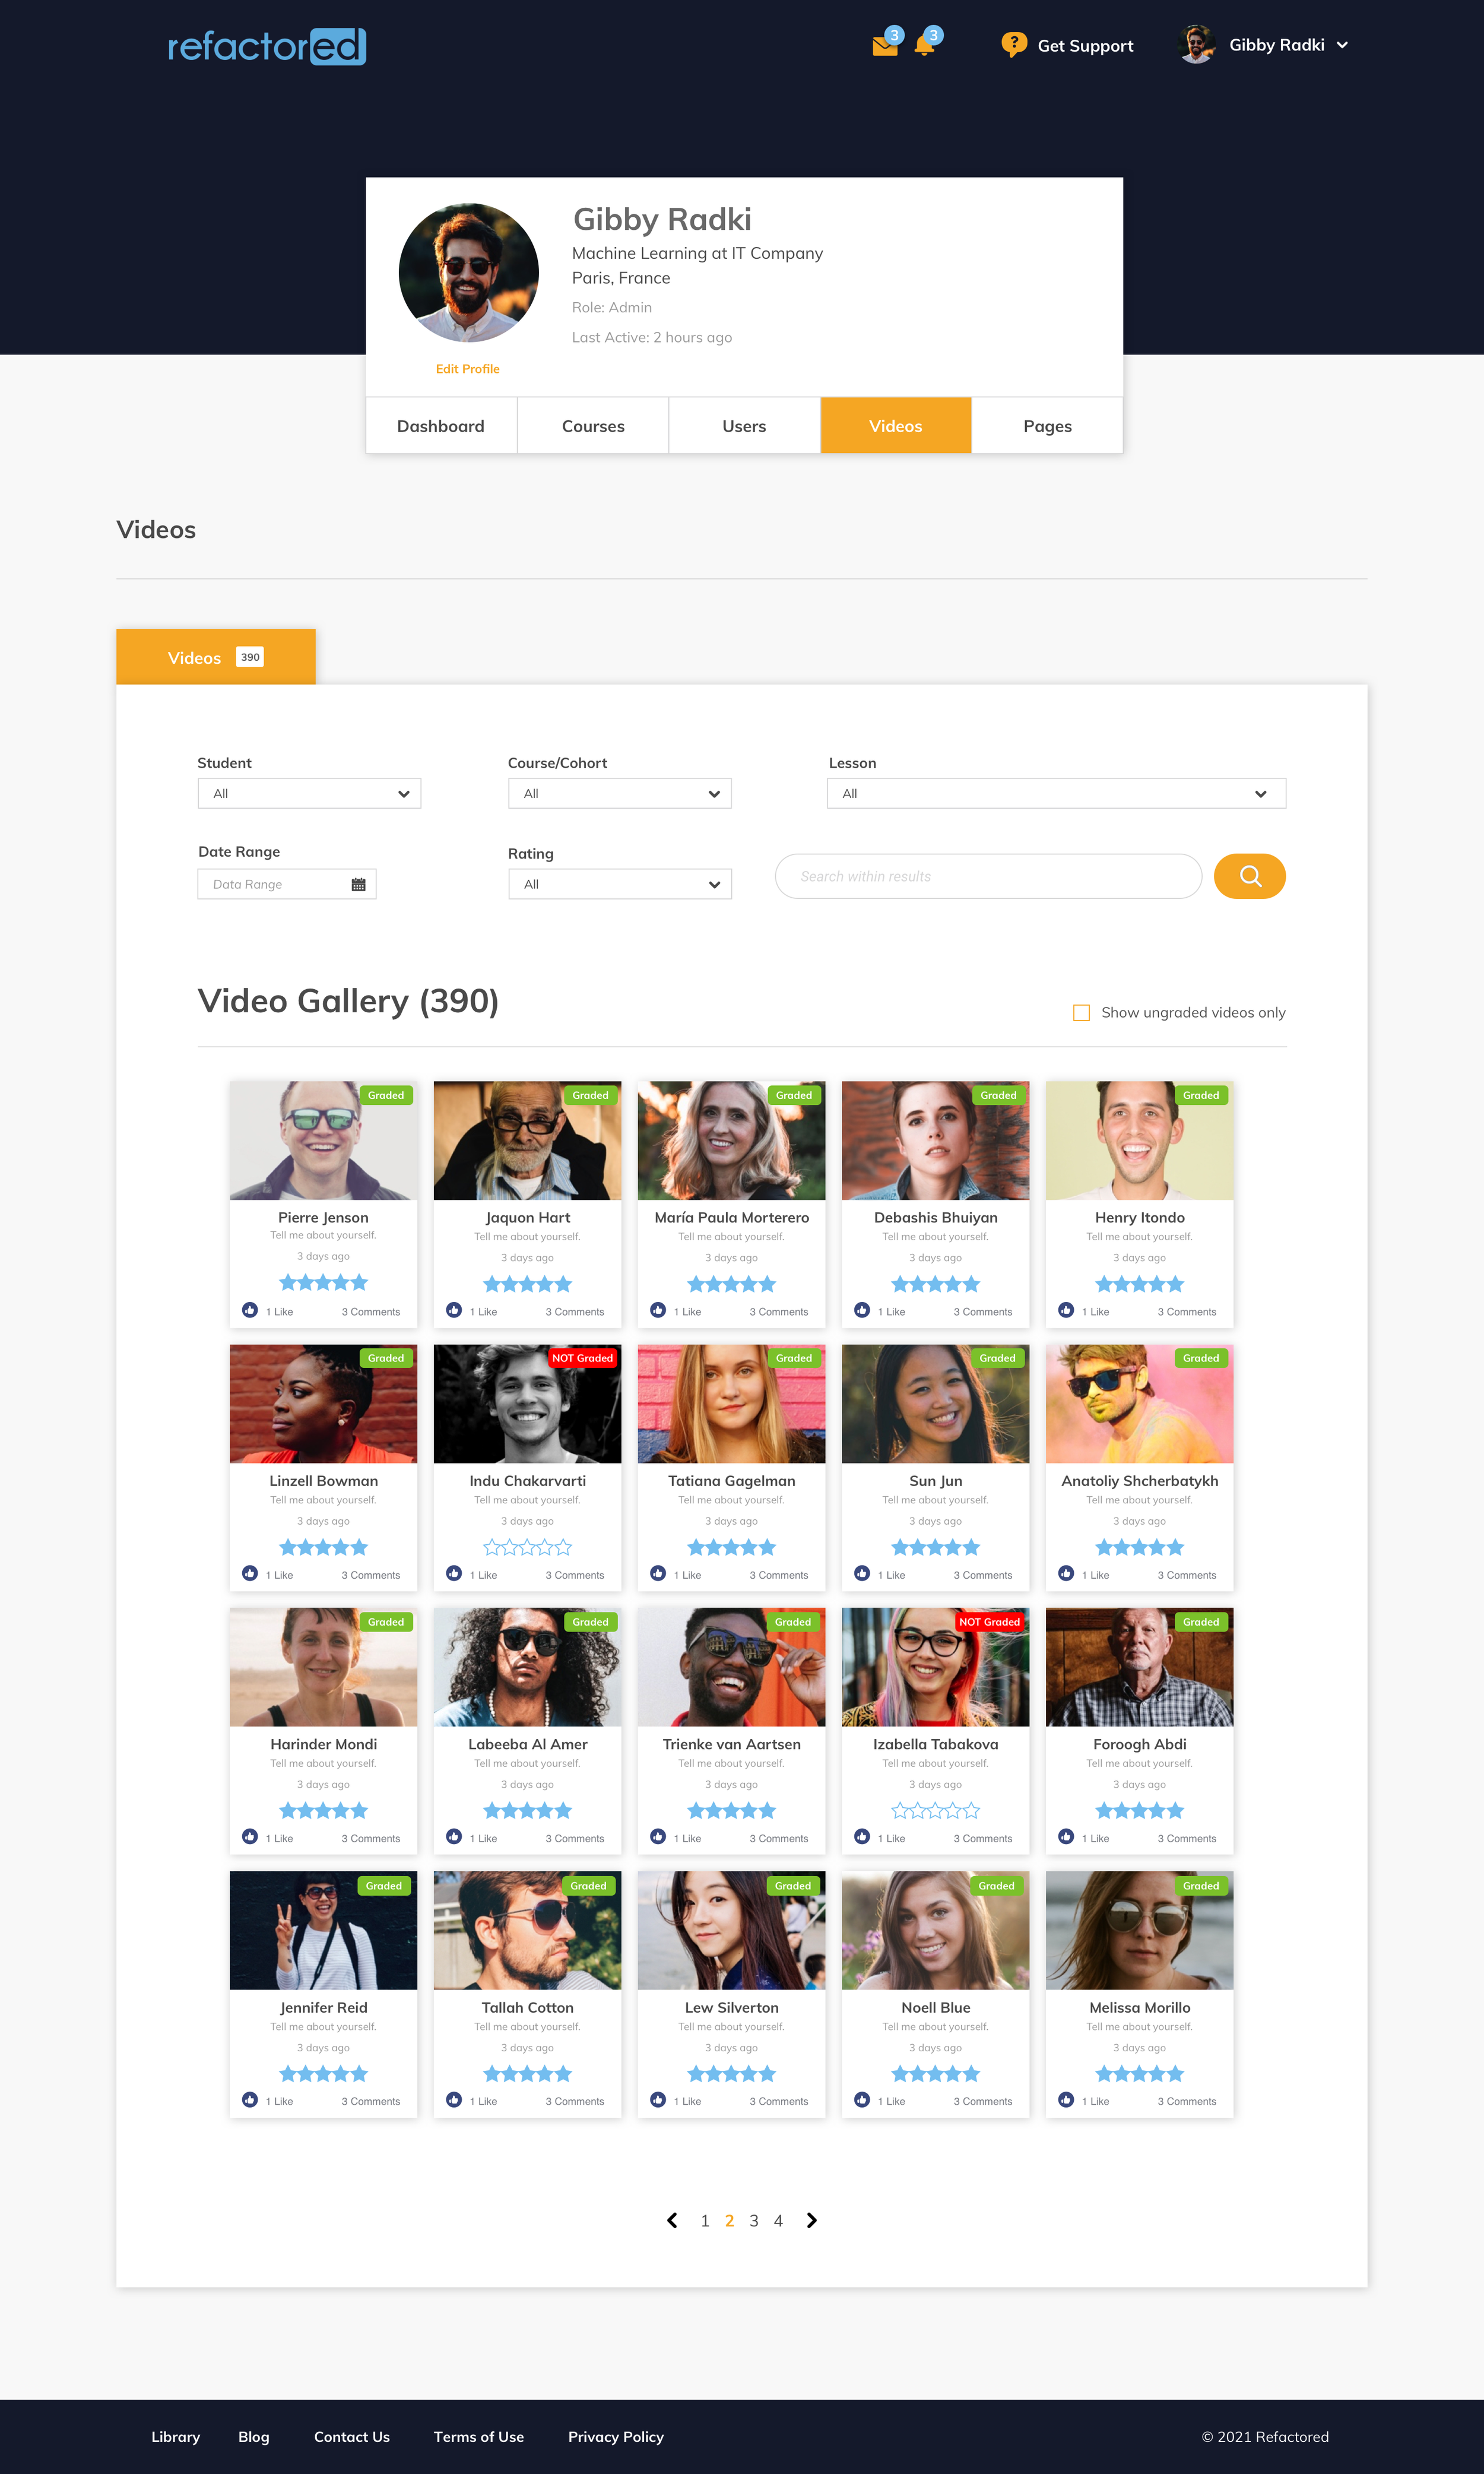
To address this challenge, we developed a system that allows students to record videos presenting newly learned concepts. This activity helps solidify their knowledge and improve their communication skills. After recording, users receive feedback from mentors and peers, enhancing their job-ready skills and confidence.
As the program expanded, scaling this service became a priority. Our data science, design, and engineering teams collaborated to create an AI-driven tool that provides on-demand feedback, empowering mentors with nuanced insights to guide their mentees effectively. The combination of video-based skill presentation and AI-powered feedback enhances the learning experience, fostering personal and professional growth for our students.
Colaberry’s Artificial Intelligence Video Feedback System (CAI VFS)- Enhancing Communication Skills with AI
The Colaberry Artificial Intelligence Video Feedback System (CAI VFS) uses advanced technology, including emotion and facial detection, and speech-to-text systems to enhance learners' communication skills. It provides feedback on two video metrics and two audio metrics, offering a comprehensive assessment.
The video metrics focus on non-verbal communication. The facial expression metric evaluates the learner's ability to convey a friendly expression, crucial for effective communication. The head pose metric assesses their positioning and eye contact, particularly useful for video interviews and conversations.
The audio metrics aim to improve speech patterns. The speech rate metric measures words spoken per minute, impacting communication effectiveness. The number and duration of pauses metric helps speakers collect their thoughts and deliver ideas confidently.
By analyzing these metrics, CAI VFS helps learners improve their communication skills comprehensively. It enables them to develop non-verbal communication, regulate speech rate, and master effective pausing, fostering proficiency and confidence in professional settings.
Transformation Through Video Feedback: Boosting Learner Confidence & Employability
Each week, our learners complete video assignments where they explain learned concepts, receiving feedback from the Colaberry AI Video Feedback System (VFS). This AI-driven tool provides valuable feedback on their speech and presentation, significantly boosting their confidence for interviews. Many learners receive job offers after just two interviews, demonstrating the effectiveness of this approach. Witness the transformative impact of our video feedback system below, showcasing learners' growth and development.
Unlocking Communication Potential with AI Video Feedback
At Refactored, we've integrated the advanced Colaberry AI Video Feedback System (CAI VFS) into our platform to enhance your communication skills. Using cutting-edge machine learning, CAI VFS provides detailed feedback on your facial expressions, head pose, speech rate, voiced ratio, and filler word rate. This tool helps you improve your non-verbal communication and speech delivery, ensuring you can communicate effectively and confidently. With CAI VFS, you'll receive a full transcription of your video, giving you a comprehensive overview of your presentation. Explore how CAI VFS can transform your communication skills and boost your success.
Step 1: User is prompted to either record a video using their camera or upload a prerecorded video.

Step 2: When choosing to record from camera they are asked to give permission to use their camera and microphone. The video feed is then displayed in the frame. Users can take this time to makes adjustments to light, background, and camera positioning. Once they are ready they can begin recording by clicking on the “Start Recording” button.

Step 3: Once a user starts recording, a countdown timer begins to notify the user that recording is about to begin.

Step 4: The user begins recording after the countdown has been completed.

Step 5: When you are done recording, you click on the “Stop Recording” button. This then allows you to playback your video if you wish to review it. After your review, you can either rerecord your video or accept and publish your video for processing.

Step 6: When a video recording is accepted, the video is then processed in the browser and preparing the automated feedback.

Step 7: When video has finished processing user clicks on “View Feedback" button to view their feedback. Thumbnail appears below video frame.

Step 8: Feedback is presented in a new browser tab